ExplainSpeaking-Economy is a weekly newsletter by Udit Misra, delivered in your inbox every Monday morning. Click here to subscribe
Dear Readers,
Last week was quite hectic if one tracks the Indian economy. Apart from the ups and downs of the stock markets, the Niti Aayog came up with a National Multidimensional Poverty Index. This index uses the methodology used by Oxford Poverty and Human Development Initiative (OPHI) and looks at various parameters of health, education and standard of living to arrive at the index. However, it should also be noted that this report only provides the baseline for the index since it uses data from the fourth round of the National Family Health Survey, which was released in 2015-16. Considering that last week also saw the release of the fifth round of the NFHS, the poverty index would need to be updated quickly.
This week will likely see politics dominate everything else as the Winter Session of the Parliament gets underway. However, on the economic front, the biggest news peg will come when the Ministry of Statistics and Programme Implementation releases the GDP data for the second quarter (that is, the period covering July, August and September).
Before we get down to what to look for in the Q2 data, here’s a quick recap on some of the GDP explainers:
As explained in the past, the better way to read the Q2 GDP data would be to look at the absolute levels of real GDP (gross domestic product) and GVA (gross value added) — the demand-side and the supply-side methods, respectively, of calculating a nation’s total income. One should avoid focussing on growth rates per se. Growth rates provide a good understanding in normal times, but, thanks to the low base of GDP and GVA set in 2020-21, every quarter will throw up very handsome growth rates. However, such fast growth rates may hide the true pain in the economy.
Let’s first see what to look for in the GDP data for this quarter. GDP provides a national income estimate by looking at the demand side of the economy. In other words, GDP measures who spent how much and then aggregates it to arrive at the total national income.
The table below gives the data for the total GDP and its four key subcomponents for the past 5 years.
As such, broadly speaking, GDP is the total of
- All the money that you and I as private individuals spend [C]
- All the money that our government spends [G]
- All the money that businesses spend (or invests) [I]
- The net effect of exports (what foreigners spend on our goods) and imports (what Indians spend on foreign goods).
As the table below shows, last year Q2’s GDP had fallen to levels last seen 2017-18. This year, if we assume that the State Bank of India’s forecast to be correct, the GDP is expected to grow by 8.1% over the last year’s level and be around Rs 35.63 lakh crore.
Second quarter real GDP (in Rs crore)
The first thing to note is that, if this happens, while it would be an impressive recovery, it would fall short of the so-called V-shaped recovery. That’s because it would still bring the GDP level just back to what it was in the second quarter of 2019-20.
As such, it again shows that the Indian economy has effectively lost two years of economic growth. If the economy grew at a 6% level in each of these years — that is FY21 and FY22 — then it would have touched the Rs 40 lakh crore mark (last row, last column in Table 1). For a true blue V-shaped recovery, this is the level that the economy had to achieve in total GDP. As things stand, at a 6% growth rate, India would take another two years before its Q2 GDP reaches the Rs 40 lakh crore mark.


Now let’s evaluate what may or may not happen on the GVA front. The GVA is another way to calculate national income; in this case, one calculates the overall value added by different productive sectors of the economy.
The table below gives the GVA data for the different productive sectors of the economy over the past 5 years.
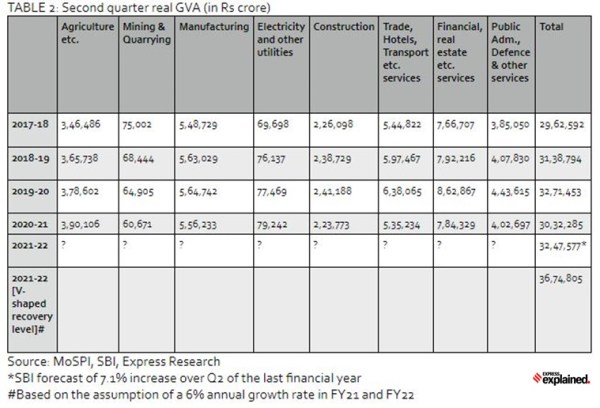

The total GVA, as forecast by SBI, is expected to grow by 7.1% over the GVA in Q2 of the last financial year. But, again, the last row, last column entry shows what a V-shaped recovery level might be, and that India will take another two years before it reaches that level. In essence, it underscores the loss of two full years for the Indian economy.
Among the sub-components, the most important one would be “manufacturing”. As the data shows, manufacturing has largely been stagnant over the past four years. This is one sector that has the best hope of creating millions of new jobs, especially for an India that is not highly skilled.
Newsletter | Click to get the day’s best explainers in your inbox
Going forward, that is in Q3 (October, November and December) and Q4 (January to March), the GDP and GVA data would perhaps be decided by the manner in which the news Covid variant — Omicron — is handled.
You can do your bit by getting vaccinated and wearing masks. And Write to me at udit.misra@expressindia.com
Regards,
Udit
