Nifty abandoned the pullback rally in a very short span and resumed its downward journey with a lower high, lower low formation. Nifty’s last two days’ rally panned out to be a mere false relief rebound as most of Nifty gains evaporated and most importantly, the benchmark ended at its lowest point of the day.
On June 22, the benchmark index witnessed a gap down opening of almost 100 points and formed a lower high, lower low pattern which continued negative bias on the intraday chart. Index closed below 15,500 levels with a loss of almost one and half percent on the daily chart.
After July 2020, this is the first time when prices are trading below 200–week exponential moving averages and are sustaining below the same on the weekly scale. On the indicator front, momentum oscillator RSI (14) is forming lower bottom since October 2021 and continuing to follow the same. Currently, RSI is settled below 40-levels on the daily as well as weekly time frame with bearish crossover.
The support for the Nifty is placed near 15,200-levels and if prices close below the same then previous year’s low will be tested which is placed near 14,800 levels. On the higher side, the immediate resistance for the index is placed at 15,750 levels and above those 15,900 levels.
Here are two buy calls for next 2-3 weeks:
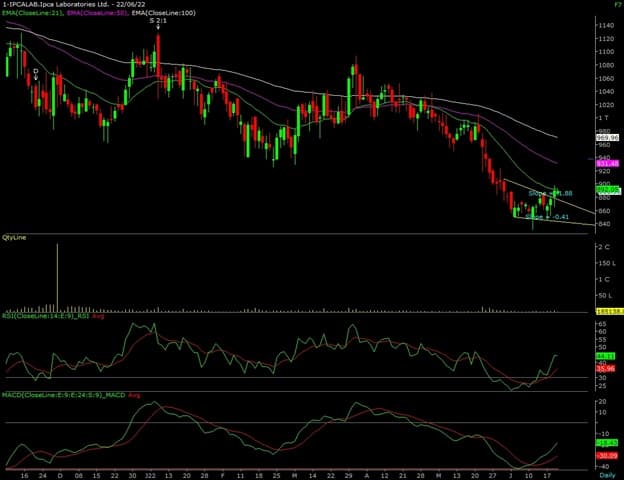
Ipca Laboratories: Buy | LTP: Rs 889 | Stop-Loss: Rs 850 | Target: Rs 940 | Return: 6 percent
Ipca Laboratories, on the daily chart, has given a consolidation breakout on June 21 and prices have formed an accumulation phase near Rs 850 levels.
In terms of candlestick, prices have formed an Inverted Hammer Bullish reversal pattern and prices have completed a basing formation near the lower level of the pattern on the weekly time frame.
Momentum oscillator RSI (relative strength index – 14) witnessed a sharp reversal from the oversold levels and since then was hovering within the 30 – 40 levels. Recently the RSI has also witnessed a range breakout above 40 levels with positive crossover on the daily time frame.
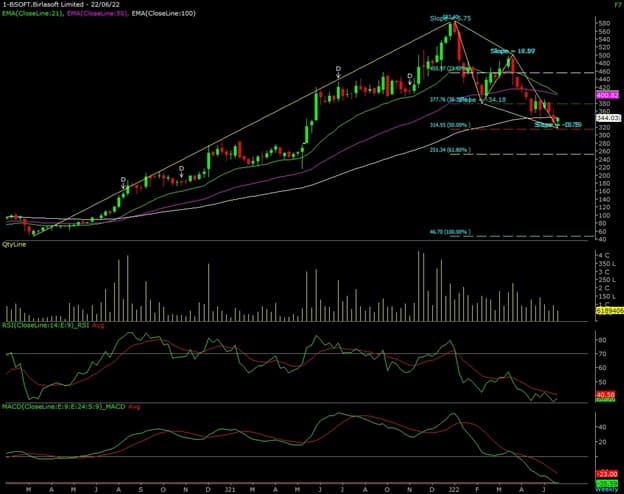
Birlasoft: Buy | LTP: Rs 342.55 | Stop-Loss: Rs 329 | Target: Rs 364 | Return: 6.2 percent
The stock has completed a bullish ABCD Harmonic pattern at Rs 320 levels and currently prices are trading within the PRZ (potential reversal zone) on the weekly time frame.
In terms of candlestick, prices have formed a Bullish Harami pattern and prices have completed a basing formation near the lower level of the pattern on the weekly time frame.
The momentum oscillator RSI (14) is showing a positive divergence at oversold levels and has sustained above 30 levels. Furthermore prices have completed its 50 percent retracement from the March 2020 low.
Disclaimer: The views and investment tips expressed by investment experts on Moneycontrol.com are their own and not those of the website or its management. Moneycontrol.com advises users to check with certified experts before taking any investment decisions.


