The market extended uptrend for second consecutive week ended July 29 as bulls retained their stronghold on Dalal Street, amid positive global cues after US Federal Reserve’s commentary. Nifty50 decisively reclaimed the long-awaited 200 days moving average (DMA) which was placed at 17,033 with a gap up opening on Friday and settled at a three-month high of 17,158. During the week, the index gained 439 points or 2.6 percent.
Every sector participated in the market rally and the participation was also seen in the broader space. Following a runaway gap up opening on Friday, the Nifty50 formed bullish candle on the daily charts with continuing higher high and higher low formation, while there was bullish engulfing candle formation on the monthly scale, indicating the positive momentum.
Hence, if the Nifty50 sustains 16,800-16,950 levels in coming sessions which are crucial support levels, the index could march towards 17,300-17,500 levels, experts said.
Ruchit Jain, Lead Research at 5paisa believes the data is still positive and until the index breaches any important supports or witness short formations by the stronger hands, one should not pre-empt any reversal for now.
On the higher side, 17,300-17,400 will be the important resistance zone. And hence, traders can look to book profits and take money off the table there. Trading with a stock specific approach and booking profits at higher levels should be the approach to trade the markets in the coming week, Ruchit advised.
He said the near term support for the index has shifted higher and is now placed around 16,930 while the medium term support base has shifted higher to 16,550 and 16,420.
Here are the top 10 trading ideas by experts for the next three-four weeks. Returns are based on the July 29 closing prices:
Expert: Subash Gangadharan, Senior Technical and Derivative Analyst at HDFC Securities
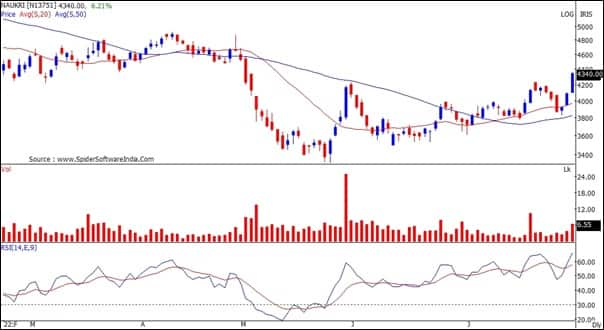
Info Edge: Buy | LTP: Rs 4,336.4 | Stop-Loss: Rs 3,900 | Target: Rs 5,000 | Return: 15.3 percent
After correcting from a high of Rs 7,465 in October 2021, Naukri found support around Rs 3,313 levels in May 2022. These are strong supports as the stock has found support around these same levels in the recent past and they also coincide with the 200 weeks SMA. On Friday, the stock reversed its downtrend by crossing its previous swing high of Rs 4,225.
Technical indicators are giving positive signals as the stock is trading above the 20 and 50 days SMA and there also recently a positive moving average crossover as the 20 days SMA moved above the 50 days SMA. Momentum readings like the 14-week RSI (relative strength index), too, are in rising mode and not overbought, which implies potential for further upsides.
With the intermediate setup too looking attractive, we expect the stock to move up towards its previous intermediate highs in the coming weeks. Buy between Rs 4,320-4,360 levels, with a stop-loss at 3,900 while target is at Rs 5,000.
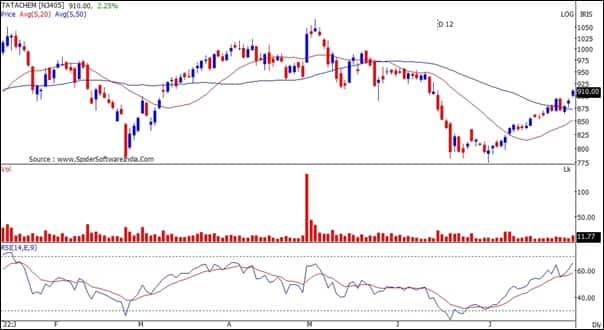
Tata Chemicals: Buy | LTP: Rs 909.9 | Stop-Loss: Rs 862 | Target: Rs 1,000 | Return: 10 percent
Tata Chemicals recently made a double bottom pattern around Rs 780 levels. The stock has been steadily rising from there and making higher tops and higher bottoms in the process. Last week, the stock broke out of a consolidation range and also closed above the 200 days EMA (exponential moving average) in the process.
With the stock trading above key moving averages like the 20 day and 50 day SMA (simple moving average), the intermediate technical setup is looking positive and momentum readings like the 14-week RSI in rising mode and not overbought, this augurs well for the uptrend to continue.
We therefore recommend a buy between Rs 900-915 levels, with a stop-loss at Rs 862 while target is at Rs 1,000.
Expert: Shrikant Chouhan, Head of Equity Research (Retail) at Kotak Securities
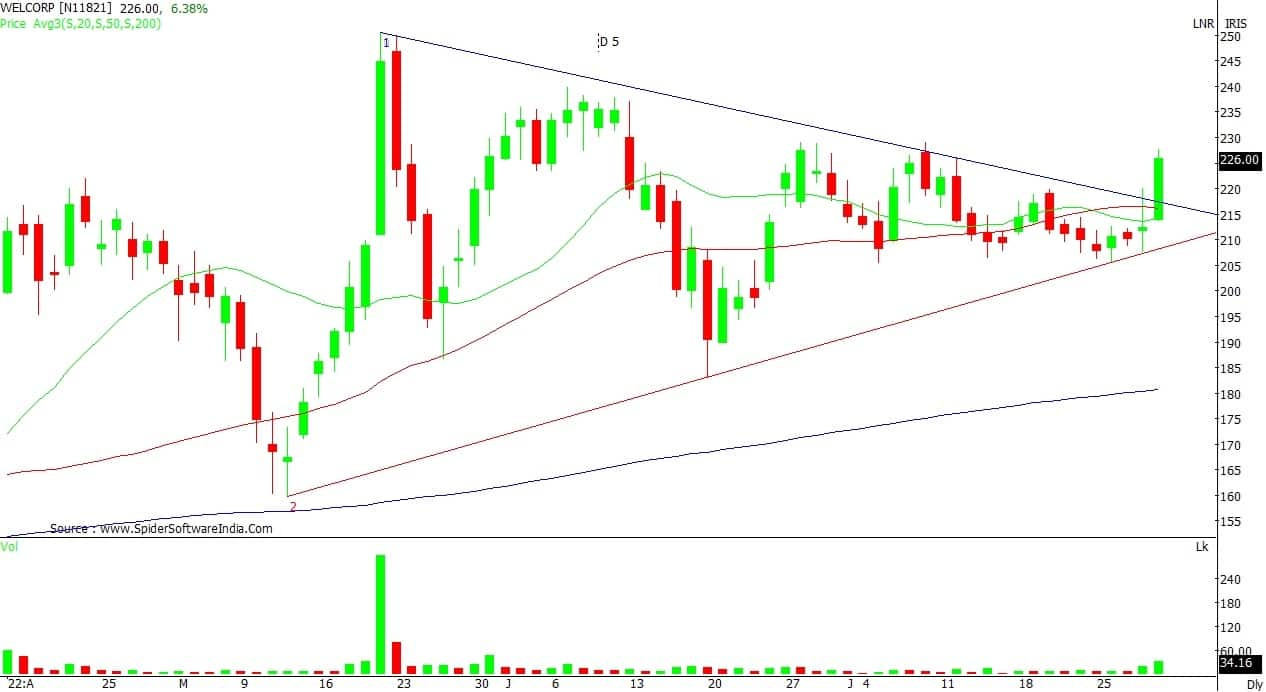
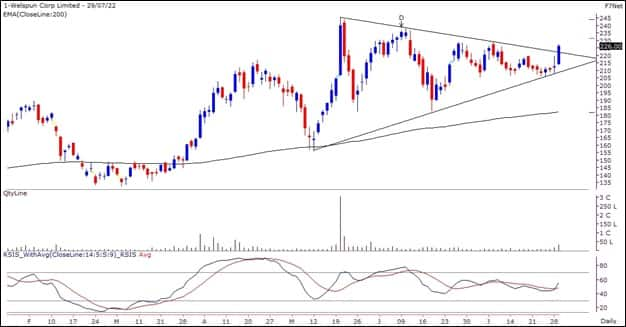
Welspun Corp: Buy | LTP: Rs 226 | Stop-Loss: Rs 210 | Target: Rs 250 | Return: 11 percent
The stock has absorbed the selling pressure on a falling trend line. The primary trend of the stock is positive but since May 2022 it was consolidating within a broad trading range of Rs 250 and Rs 190.
It usually happens with stocks in the midcap basket. It is a bullish continuation formation and we should buy at current levels.
We can place a stop-loss at Rs 210. At higher levels, it could move towards Rs 250 and Rs 270 in the coming weeks.
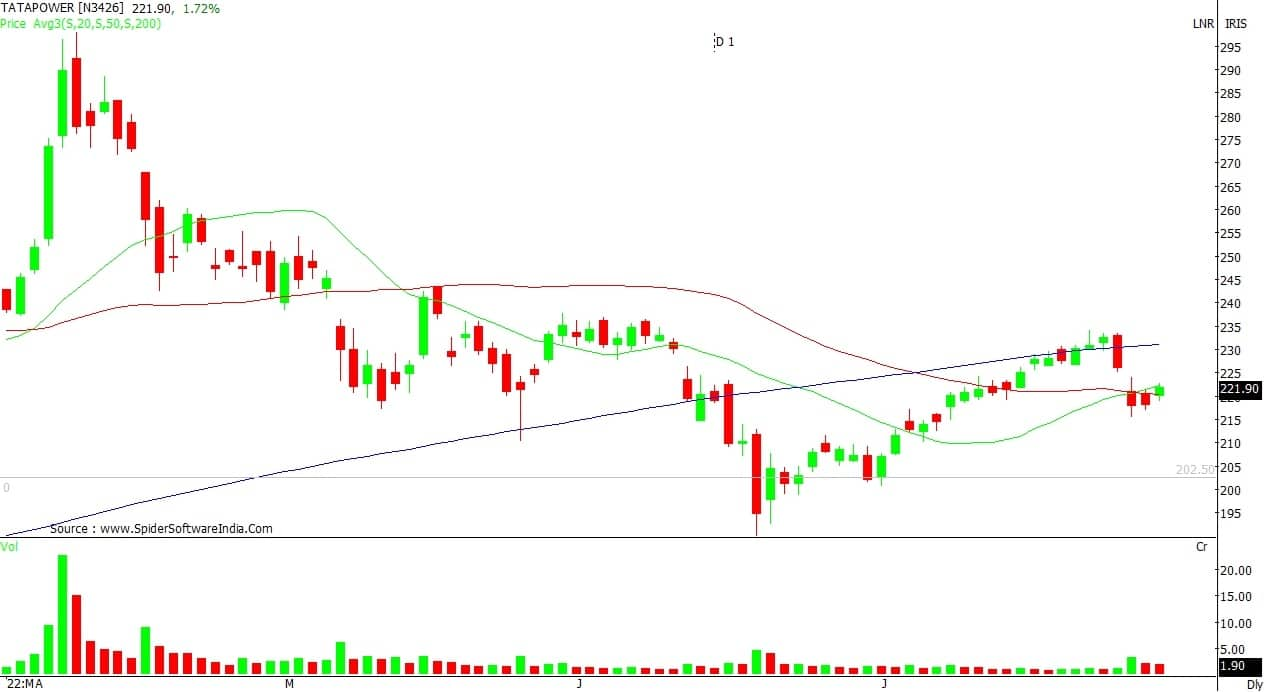
Tata Power Company: Buy | LTP: Rs 221.90 | Stop-Loss: Rs 210 | Target: Rs 255 | Return: 15 percent
It stood at Rs 282 in the month of April 2022, the all-time high for the stock and fell to Rs 190 levels in a span of two months. However, gradual recovery from the current levels is indicating a rounding bottom consolidation formation.
We can expect a gradual recovery from the current levels. In the near term, it may face resistance at Rs 240 and Rs 255. We advised to buy at current levels with stop-loss at Rs 210.
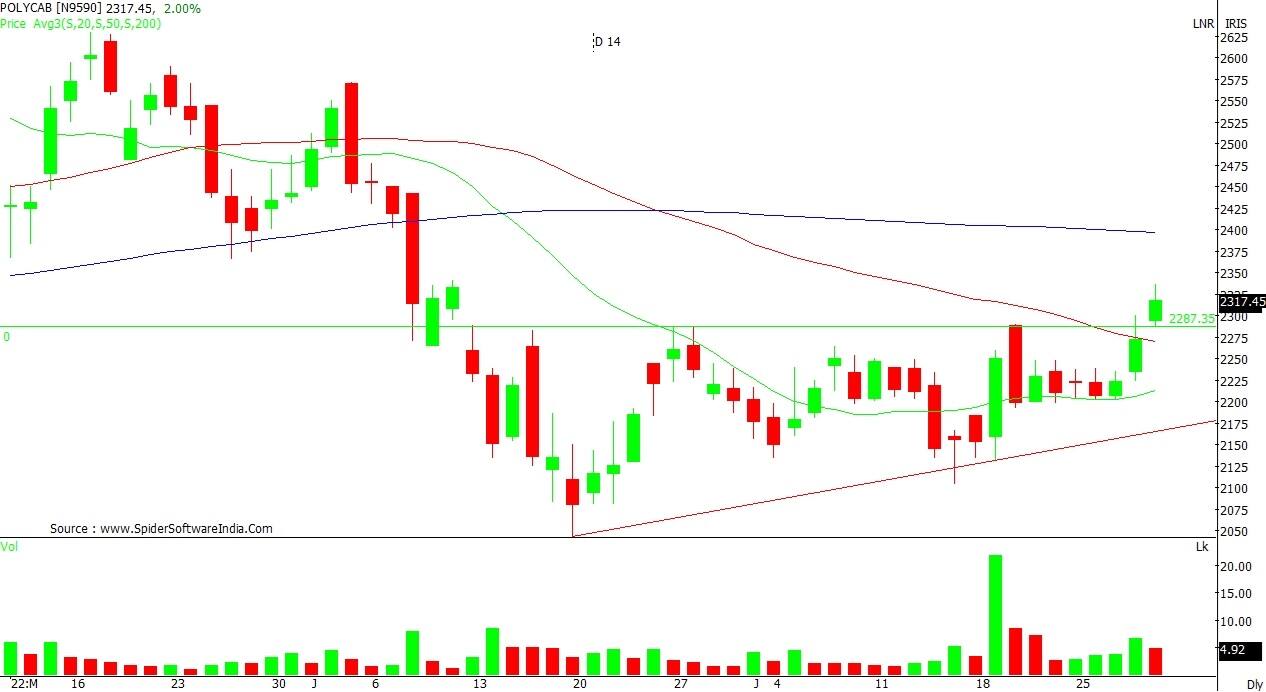
Polycab India: Buy | LTP: Rs 2,317.45 | Stop-Loss: Rs 2,200 | Target: Rs 2,500 | Return: 8 percent
It broke the ascending triangle consolidation resistance at Rs 2,290 on Thursday. On a weekly basis, it closed above it with a positive convergence on the major oscillators.
Based on the break-out formation, we can expect the stock at Rs 2,500 in the near term. It is a buy candidate at current levels. Place a stop-loss at Rs 2,200.
Expert: Ruchit Jain, Lead Research at 5paisa.com
Welspun Corp: Buy | LTP: Rs 226 | Stop-Loss: Rs 210 | Target: Rs 245 | Return: 8.4 percent
The stock has been forming a ‘higher top higher bottom’ formation on the longer time frame chart and is thus in an uptrend. Within this broader uptrend, prices have recently seen a time wise correction as the markets have seen a corrective phase.
However, the stock has now given a breakout from the consolidation phase with rising volumes. The momentum oscillator has also given a positive crossover and hence the chart structure indicates resumption of the higher degree uptrend.
Hence, traders can look to buy the stock in the range of Rs 226-223 for a potential target of Rs 245 in the near term. The stop-loss should be placed below Rs 210.
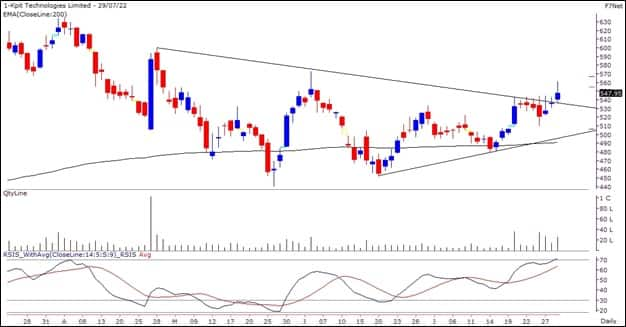
KPIT Technologies: Buy | LTP: Rs 547.95 | Stop-Loss: Rs 518 | Target: Rs 595-600 | Return: 9.5 percent
The IT sector has rebounded from the swing lows during last week and stocks within the sector have witnessed pullback moves. This stock has consolidated within a broad range in last few months around its ‘200-day EMA’ support.
Prices have now again started forming a ‘higher top higher bottom’ formation on the daily chart. The volumes along with the price upmove have started increasing and the ‘RSI’ oscillator is hinting at a positive momentum.
Thus, traders can look to buy the stock in the range of Rs 548-544 for potential targets of Rs 595-600 in the near term. The stop-loss can be placed below Rs 518.
Expert: Jatin Gohil, Technical and Derivative Research Analyst at Reliance Securities
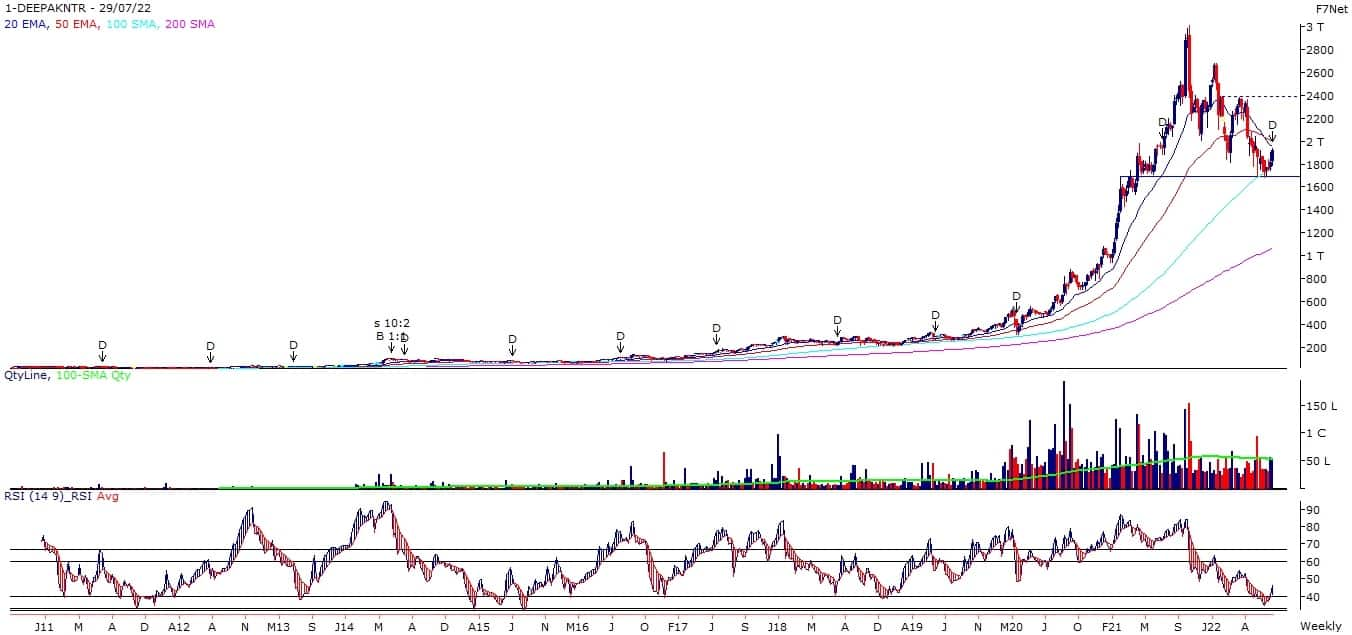
Deepak Nitrite: Buy | LTP: Rs 1,919.4 | Stop-Loss: Rs 1,681 | Target: Rs 2,390 | Return: 24.5 percent
After a higher level of reversal, the stock found support around its point of polarity, which was placed at around Rs 1,700. Later, the stock formed a base around that point and resumed its up-move.
Its weekly RSI again reversed from its bull market support zone (40-33) and gave a buy signal. In the past, the stock witnessed a substantial rebound after an identical reversal in the RSI. We believe history repeats itself, which will support a healthy bounce in the stock.
On the higher side, the stock may face hurdle around its 20-week and 50-week EMAs, which are currently placed at Rs 1,960 and Rs 2,000, respectively. A stable move above that short-term moving averages will accelerate positive momentum, which could take the stock towards Rs 2,390, where its prior swing high is placed.
In case of any decline, the stock will find support around its prior swing low (placed at Rs 1,681).
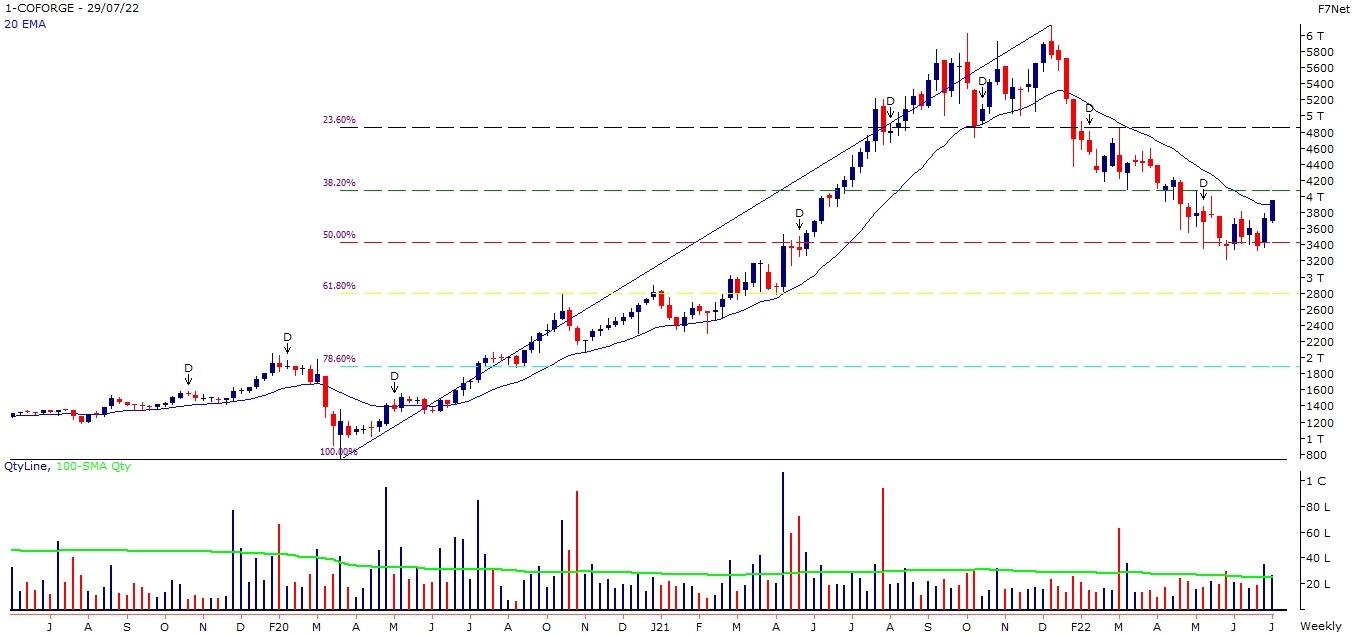
Coforge: Buy | LTP: Rs 3,954.3 | Stop-Loss: Rs 3,580 | Target: Rs 4,850 | Return: 23 percent
The stock retraced 50 percent of its mega up-move (Rs 735-6,135) in late-May 2022 and bounced after a base formation. On week ended July 29, the stock closed above its 20-week EMA for the first time since late-January 2022.
The key technical indicators reversed from the lower levels and witnessed a bullish cross-over subsequently.
The stock has potential to move towards its 23.6 percent Fibonacci Retracement level of prior up-move in the short-term, which is placed at around Rs 4,850.
Fresh long position can be initiated at current juncture and on dips towards Rs 3,860 for desired action.
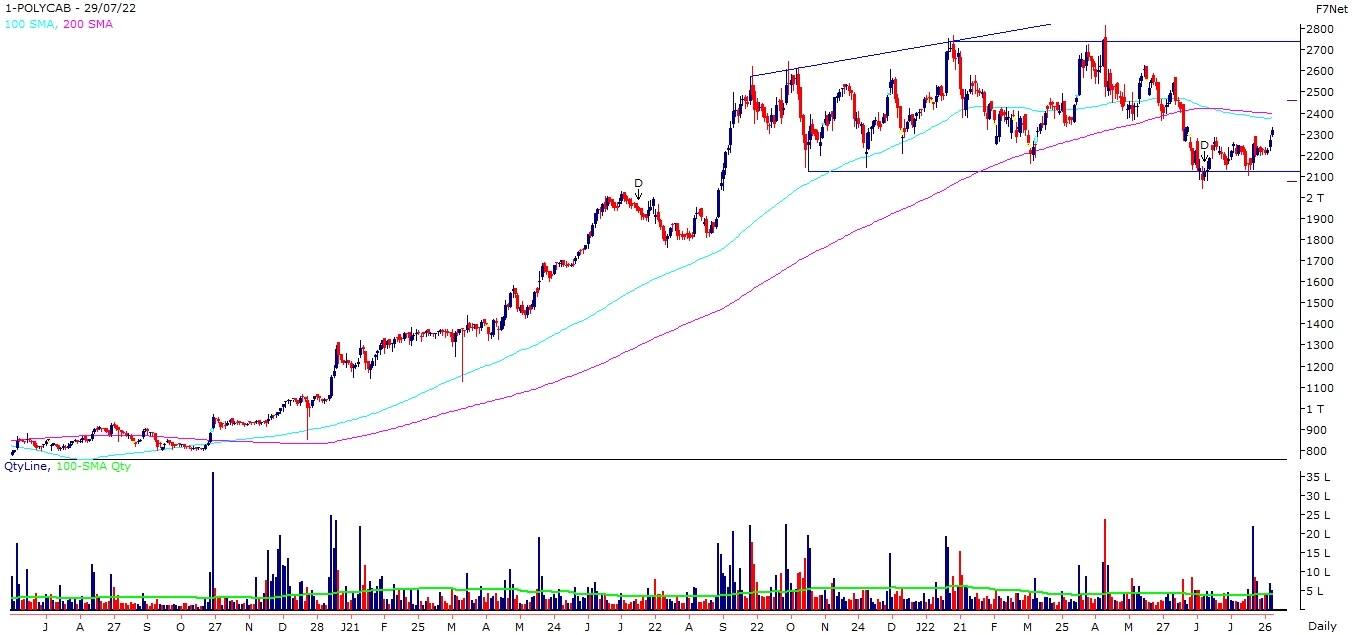
Polycab India: Buy | LTP: Rs 2,317.45 | Stop-Loss: Rs 2,120 | Target: Rs 2,740 | Return: 18 percent
After a higher level of reversal, the stock oscillated around its short-term demand zone, which was placed at around Rs 2,120. Later, the stock witnessed a breakout from that consolidation and rose to one-and-half-month high.
Above average volume and steady rise in the stock indicates that major market participants are in favour of the bulls. The key technical indicators are in positively poised on the short-term timeframe chart.
On the higher side, the stock may face hurdle around its 100-day and 200-day SMAs, which are placed at Rs 2,375 and Rs 2,395, respectively. A convincing move above those long-term moving averages will be positive for the stock. This could lead the stock towards Rs 2,630 initially and Rs 2,740 subsequently.
Disclaimer: The views and investment tips expressed by investment experts on Moneycontrol.com are their own and not those of the website or its management. Moneycontrol.com advises users to check with certified experts before taking any investment decisions.


